skip to main
|
skip to sidebar
The Map Catalog
Friday, April 17, 2009
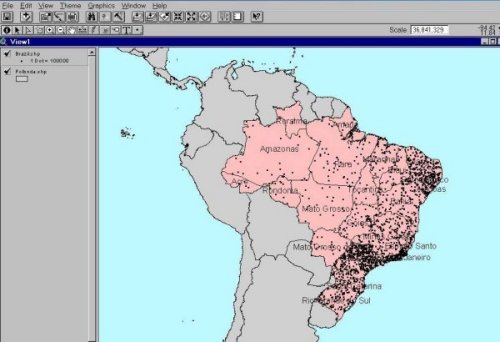
dot distribution map
http://proceedings.esri.com/library/userconf/educ02/pap5027/p50272.jpg
A dot distribution map shows the distribution of data using dots to represent density. This map is especially used to show population density. This is a map of population distribution in South America.
No comments:
Post a Comment
Newer Post
Older Post
Home
Subscribe to:
Post Comments (Atom)
Followers
Blog Archive
▼
2009
(50)
▼
April
(50)
isotherms
unclassed choropleth map
classed choropleth maps
range graded proportional circle map
accumulative line graph
mental map
nominal area choropleth
univariant choropleth
standardized choropleth
propaganda map
star plot
correlation matrix
similarity matrix
stem and leaf plot
box plot
histogram
parallel coordinates
triangle plot
windrose
climograph
population pyramid
bilateral graph
index value plot
scatterplot
DOQQ
DEM
DLG
DRG
isopleths
isopachs
isohyets
isotachs
isobars
LIDAR
dopplar radar
black and white aerial photo
infared aerial map
statistical map
cartogram
flow map
isoline map
proportional circle map
choropleth map
dot distribution map
hypsometric map
plss
cadastral map
thematic map
topographic map
planimetric map
About Me
map analysis
View my complete profile

No comments:
Post a Comment